
Rainstone Water Heaters research program · Data: EPA/USGS Water Quality Portal pulled October 30, 2026 · Verification: utility-published figures retrieved October 30, 2026
The short version
Plenty of websites will sell you a ranked list of the hardest water in Texas. Almost all of them are built from raw monitoring data — samples taken from wells, rivers, and reservoirs — and presented as if that were the water coming out of your tap. It often isn’t. So we built this ranking differently: a county only makes the list when two independent sources agree — the federal monitoring record, and the water utility’s own published hardness figure, landing in the same hardness band.
Six Texas counties passed that test. Here they are.
The verified ranking
| Rank | County | Median hardness (mg/L) | Grains/gal | Band | Samples (n) | Confirmed by |
|---|---|---|---|---|---|---|
| 1 | Bexar | 274 | 16.0 | Very hard | 6,217 | San Antonio Water System: 180–310 mg/L in its water quality report |
| 2 | Comal | 259 | 15.1 | Very hard | 382 | New Braunfels Utilities: 202 mg/L |
| 3 | Williamson | 202 | 11.8 | Very hard | 2,031 | City of Round Rock: 249 mg/L average |
| 4 | Reeves | 150 | 8.8 | Hard | 130 | City of Pecos: 133 mg/L |
| 5 | Tarrant | 140 | 8.2 | Hard | 4,539 | Fort Worth sampling: 108–150 ppm |
| 6 | Collin | 134 | 7.8 | Hard | 2,445 | City of Garland: 161 mg/L average, “considered hard” |
The pattern is Central and North Texas limestone country. Bexar County (San Antonio) tops the verified list: the San Antonio Water System’s own report puts hardness between 180 and 310 mg/L, and the federal monitoring median for the county — drawn from 6,217 samples — is 274. Comal County (New Braunfels) and Williamson County (Round Rock, Georgetown) follow, both squarely in the “very hard” band above 180 mg/L on the U.S. Geological Survey scale.
Why we refused to rank the raw data
We pulled every hardness sample in the federal Water Quality Portal for Texas: 144,330 samples from 66,996 monitoring stations, covering 170 counties with at least 100 samples each. Ranked raw, 103 of those 170 counties show a “very hard” median — and the list would be topped by Childress County at 4,800 mg/L. Nobody’s tap runs at 4,800 mg/L. That number comes from wells and brine-influenced streams in the Rolling Plains, not from a kitchen faucet.
Austin shows the gap from the other direction. Travis County’s monitoring median is 250 mg/L — very hard. But Austin Water’s own laboratory summaries put the city’s finished tap water at roughly 84–90 mg/L — moderately hard, three bands lower. Treatment and source blending change the water between the aquifer and the tap. Any ranking that ignores that is selling you a map of geology and calling it your plumbing.
So the rule for this page: if a utility serving the county doesn’t publish a hardness figure that confirms the band, the county doesn’t get ranked. Dallas County is the biggest absence — Dallas Water Utilities hasn’t published hardness in its annual water quality report since 2004, so there is no current utility figure to check its monitoring median (162 mg/L) against. Denton’s current report doesn’t publish hardness either. Every county we checked, and what we found, is listed in the methodology below — including the ones that failed.
The soft end of Texas
East Texas is the mirror image. The monitoring medians for the Piney Woods counties — Hardin, Marion, Harrison, Tyler, Jasper, Newton, San Augustine, Sabine — run from 22 to 34 mg/L, deep in the “soft” band, a fraction of the Central Texas numbers. Small East Texas systems rarely publish their own hardness figures, so under our rules those counties are described here rather than ranked — but the regional pattern in the federal data is unambiguous: cross Texas from east to west and the water gets dramatically harder.

What very hard water does in a home
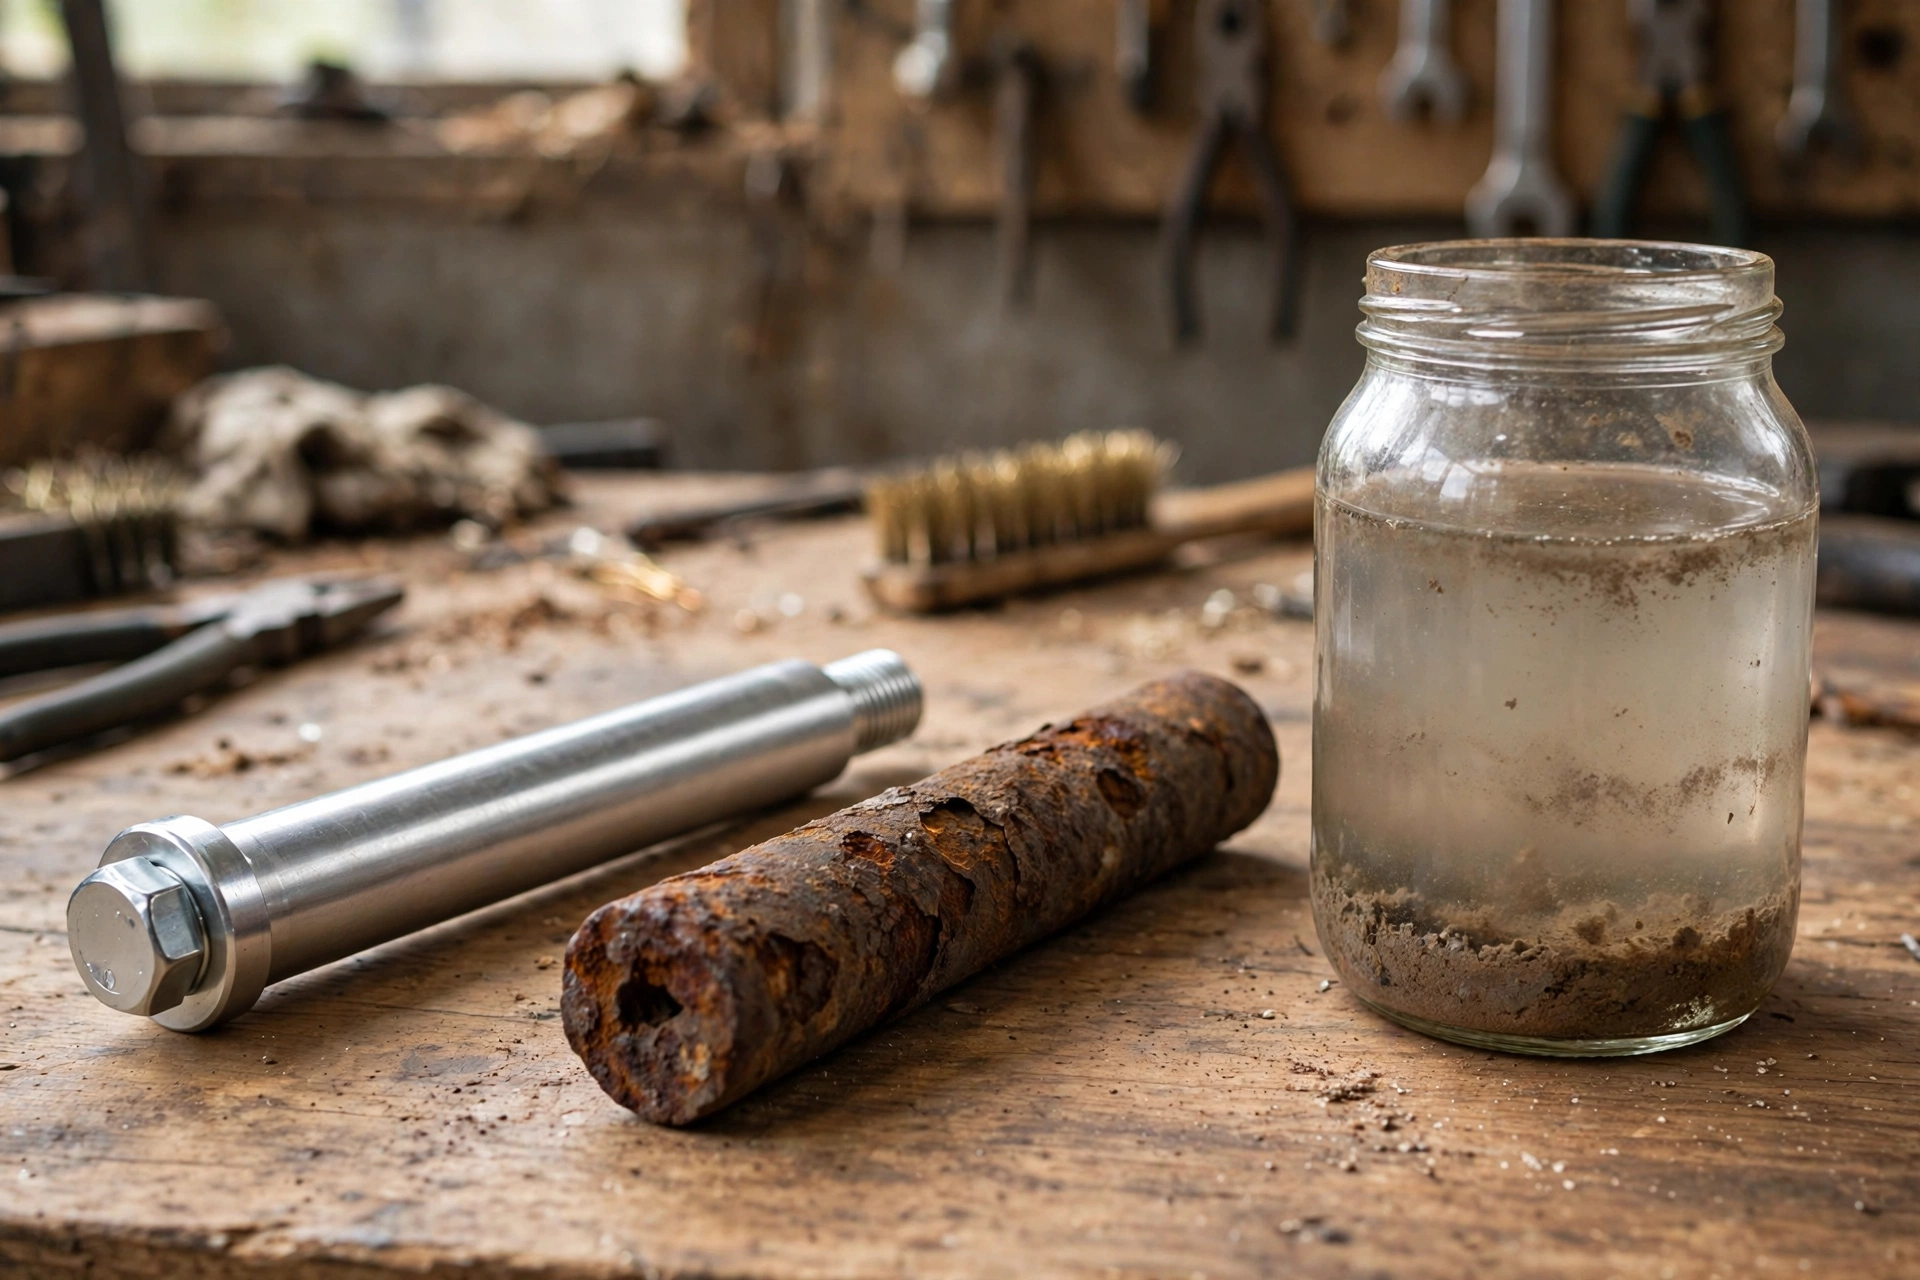
Hardness itself is not a health concern — it’s calcium and magnesium. The cost shows up in the house: scale builds on heating elements and inside tank water heaters, forcing the burner or element to work through an insulating crust; scale narrows pipes and fixtures over time; soaps and detergents underperform, which is why dishes spot and laundry dulls. In the verified counties above — where both the monitoring record and the utility’s own numbers say the water is hard or very hard — a water heater is working against that buildup every single day. If you’re on one of these systems, your utility’s published figure (named in the methodology) is the number to size any treatment decision against — not a statewide map.
Full methodology
Datasets. (1) EPA/USGS Water Quality Portal, characteristic “Hardness, Ca, Mg” (mg/L as CaCO3), Texas, pulled fresh October 30, 2026: 144,330 records, 144,304 numeric, 66,996 stations. (2) U.S. Census Bureau 2024 Gazetteer counties for station-to-county assignment (100% assigned). (3) Utility-published hardness figures retrieved October 30, 2026: SAWS water quality report and FAQ; New Braunfels Utilities; City of Round Rock 2025 water report; City of Pecos; Fort Worth sampling as published in the 2025 Richland Hills Consumer Confidence Report and Fort Worth’s water quality report; City of Garland water quality FAQ; Austin Water quarterly and monthly water quality summaries; Dallas Water Utilities annual reports (2004–present); City of Denton 2024 Water Quality Report.
Rules (fixed before the pull). County figure = median of all portal samples in the county; minimum 100 samples. USGS bands: soft 0–60, moderately hard 61–120, hard 121–180, very hard over 180 mg/L. A county is ranked only if a utility serving it publishes its own hardness figure in the same band (for published ranges, the county median must fall inside the range or the range’s central band must match). Counties checked and not ranked: Travis (disconfirmed at the tap by Austin Water’s own lab summaries), Dallas (no utility figure published since 2004), Denton (current report publishes no hardness value), the eight softest East Texas counties and the five hardest West Texas counties (no utility-published figure found; the West Texas medians reflect wells and brine-influenced streams, not taps).
Cross-check. A partial-pull analysis earlier in this program (October 22, 2026) produced metro county medians that the fresh full pull reproduces exactly in 25 of 26 counties. The exception, Hays County, reads 293 mg/L (n=1,281) in the full pull against 490 in the partial pull; the full pull supersedes and the difference is disclosed here.
Limitations. Portal samples are ambient monitoring — source water and wells, not finished tap water — which is exactly why the verification gate exists. Sampling density and years vary by county. Hardness is not a required reporting analyte, so many utilities publish none; absence of a published figure is reported as absence, never estimated. A county median describes monitored water across the county, not any individual home’s tap.
Data download. The full county dataset — all 170 qualifying counties with sample counts, medians, bands, and each county’s verification status — is available as a CSV: hardest-water-texas-counties.csv.
Rainstone Water Heaters provides water heater services across the Dallas–Fort Worth, Austin, and San Antonio areas. This study was produced by Rainstone Water Heaters using public federal data and utility-published figures; utilities listed did not sponsor or endorse it.
