Rainstone Water Heaters research program · Data: NOAA NCEI 1991–2020 Climate Normals and Census Bureau ACS 2024 5-year estimates, pulled October 30, 2026
The short version
Every Texas freeze writes the same story in a different city: a cold snap arrives, pipes in older homes split, and by the time the thaw comes, ceilings are down and floors are ruined. February 2021 wrote that story across the whole state at once. But the risk isn’t spread evenly — it concentrates where two things overlap: a climate that actually freezes, and a housing stock built before freeze protection was standard practice.
So we measured both, for every Texas city with at least 10,000 homes — 131 cities in the final dataset — and combined them into a single index. The index: average annual days at or below freezing (NOAA’s 1991–2020 climate normals) × the share of homes built before 1980 (Census Bureau, ACS 2024). Both numbers are printed next to every city’s index value, in the table and in the downloadable data. An index is a ranking device, not a probability — but the pattern it reveals is stark.
The ranking: top 25 of 131 Texas cities
| Rank | City | Index | Freeze days/yr | Pre-1980 share | Pre-1940 share | Housing units | NOAA station |
|---|---|---|---|---|---|---|---|
| 1 | Amarillo | 70.6 | 117 | 60.3% | 6.3% | 89,188 | AMARILLO 7ENE (USC00410213) |
| 2 | Big Spring | 58.0 | 72.7 | 79.8% | 6.5% | 10,462 | GARDEN CITY (USC00413445) |
| 3 | Wichita Falls | 44.8 | 69.8 | 64.2% | 10.0% | 43,371 | HENRIETTA (USC00414093) |
| 4 | Abilene | 33.0 | 58.8 | 56.1% | 7.2% | 53,156 | ABILENE 6ESE (USC00410013) |
| 5 | San Angelo | 31.7 | 60.3 | 52.5% | 4.0% | 44,176 | SAN ANGELO WFO (USC00417944) |
| 6 | Duncanville | 29.9 | 51.6 | 58.0% | 1.3% | 14,027 | JOE POOL LAKE (USC00414597) |
| 7 | Denison | 28.6 | 43.4 | 66.0% | 12.3% | 11,397 | SHERMAN (USC00418274) |
| 8 | Lubbock | 27.4 | 61.2 | 44.7% | 2.3% | 118,143 | LUBBOCK WFO (USC00415409) |
| 9 | Greenville | 26.3 | 50 | 52.6% | 5.8% | 13,090 | GREENVILLE KGVL RADIO (USC00413734) |
| 10 | Marshall | 25.9 | 38.7 | 66.8% | 9.9% | 10,007 | MARSHALL (USC00415618) |
| 11 | Lufkin | 25.1 | 51.9 | 48.4% | 4.5% | 14,555 | LUFKIN 11 NW (USC00415415) |
| 12 | Texarkana | 24.0 | 45.8 | 52.4% | 6.1% | 16,482 | TEXARKANA (USC00418942) |
| 13 | El Paso | 23.5 | 53.3 | 44.1% | 4.7% | 265,320 | LA TUNA 1 S (USC00414931) |
| 14 | Paris | 23.1 | 46.2 | 50.0% | 7.2% | 11,531 | PARIS (USC00416794) |
| 15 | Odessa | 22.0 | 43.5 | 50.6% | 0.8% | 49,871 | ODESSA (USC00416502) |
| 16 | Sherman | 21.5 | 43.4 | 49.5% | 7.5% | 19,846 | SHERMAN (USC00418274) |
| 17 | Longview | 21.0 | 38.2 | 54.9% | 2.6% | 36,746 | LONGVIEW #2 (USC00415344) |
| 18 | Kerrville | 20.3 | 46.3 | 43.8% | 3.2% | 11,650 | KERRVILLE 3 NNE (USC00414782) |
| 19 | Midland | 19.7 | 54.2 | 36.3% | 1.1% | 57,260 | MIDLAND 4 ENE (USC00415891) |
| 20 | Nacogdoches | 19.3 | 40.7 | 47.5% | 3.6% | 14,192 | NACOGDOCHES (USC00416177) |
| 21 | Waco | 19.2 | 37.8 | 50.9% | 6.3% | 61,163 | WACO DAM (USC00419417) |
| 22 | Weatherford | 19.2 | 60.8 | 31.6% | 4.8% | 14,690 | WEATHERFORD (USC00419532) |
| 23 | Garland | 19.0 | 34.7 | 54.8% | 0.4% | 86,216 | RICHARDSON (USC00417588) |
| 24 | Hurst | 19.0 | 31.6 | 60.2% | 0.6% | 16,790 | FT WORTH WSFO (USC00413285) |
| 25 | Cleburne | 18.7 | 40.6 | 46.0% | 5.5% | 12,467 | CLEBURNE (USC00411800) |
The top of the list: the Panhandle and West Texas
Amarillo stands alone at the top. It averages 117 days a year at or below freezing — nearly a third of the year — and 60.3% of its homes were built before 1980. No other Texas city combines that much cold with that much old housing; its index (70.6) clears the field by more than 20 points.
Big Spring (58.0) is second on the strength of the oldest housing stock near the top of the list — 79.8% of its homes predate 1980 — paired with 72.7 freeze days. Wichita Falls (44.8), Abilene (33.0), and San Angelo (31.7) round out a West Texas top five. The Dallas–Fort Worth metroplex enters at #6 with Duncanville (29.9), and Northeast Texas — Denison, Greenville, Marshall — clusters just behind, driven less by extreme cold (39–50 freeze days) than by housing stock where half to two-thirds of homes predate 1980.
At the other end, the Gulf Coast and the Rio Grande Valley barely register: single-digit freeze days mean even old housing rarely faces a hard freeze. The full 131-city table is in the data download.
Why “built before 1980” is the line
Pre-1980 Texas homes were typically built with plumbing routed through exterior walls and uninsulated attics, minimal pipe insulation, and — in the oldest stock — galvanized supply lines now at or past their service life. Modern codes and practice moved pipes inside the thermal envelope and normalized insulation and shutoff access. The 2021 freeze’s damage map tracked housing age for exactly these reasons. A renovated older home can beat the odds; the index measures the stock as built, which is the exposure a city carries into every freeze warning.

What to do with this if your city is on the list
- Know your shutoff. The single highest-value freeze skill is turning your home’s water off fast. Find the main shutoff before you need it.
- Insulate what’s exposed. Pipes in attics, garages, crawl spaces, and exterior walls — especially on pre-1980 homes — are where splits start.
- Mind the water heater’s neighborhood. Heaters in garages and attics sit in the coldest air in the house; their supply lines are exposed pipe runs.
- When a hard freeze is forecast: drip faucets on exterior walls, open cabinet doors under sinks, and keep the heat on — the standard guidance exists because it works on ordinary freezes.
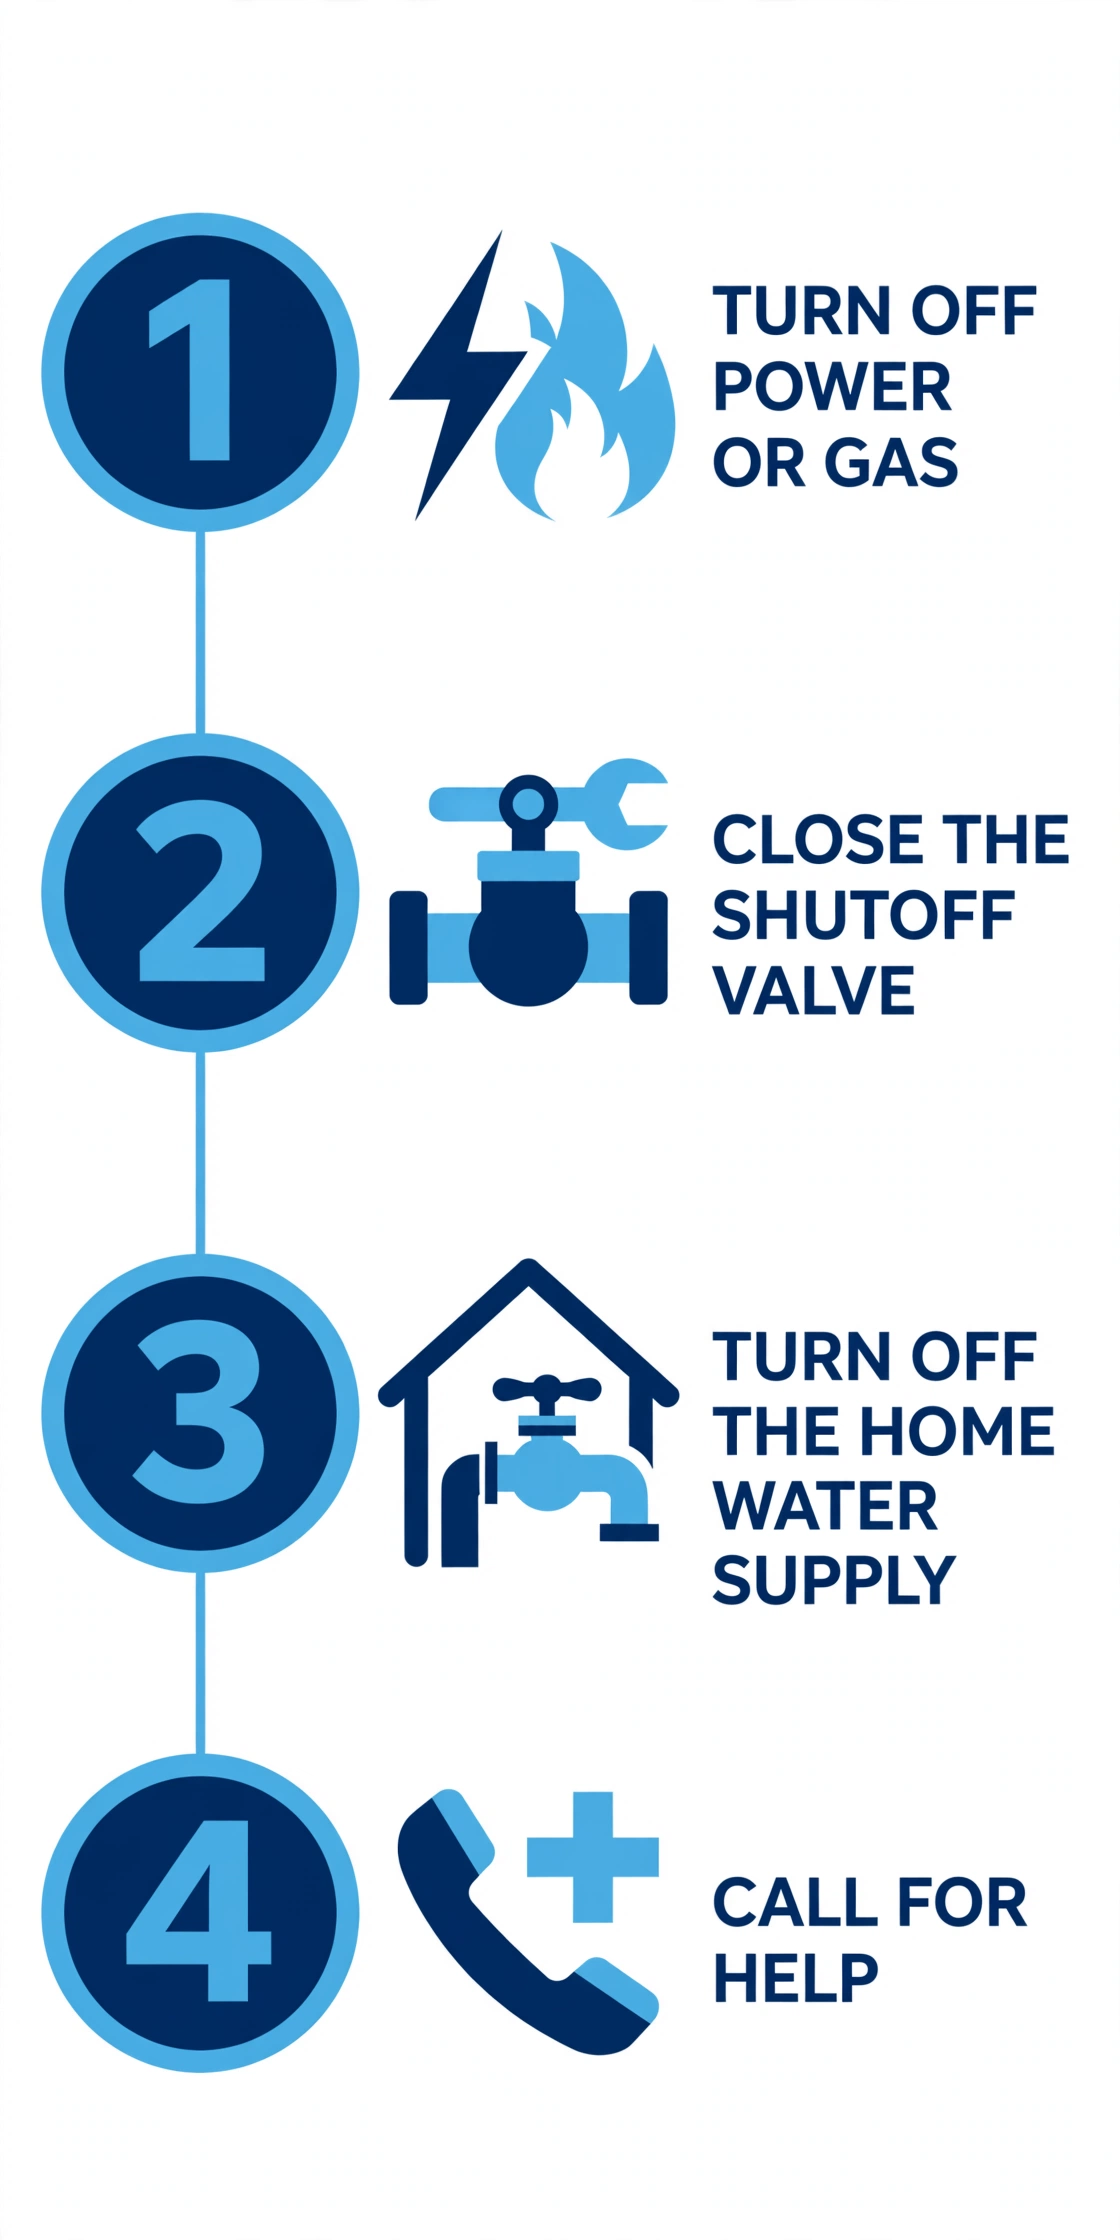
- If a pipe does burst: shut the water off first, then call a plumber. Minutes matter more than towels.
Full methodology
Datasets. (1) NOAA NCEI 1991–2020 Climate Normals (annual/seasonal station files, pulled October 30, 2026), variable ANN-TMIN-AVGNDS-LSTH032 — average annual days with minimum temperature ≤ 32°F. Each city uses the nearest station whose published normals include that variable; the station, its name, and its distance from the city centroid are in the CSV. (2) U.S. Census Bureau ACS 2024 5-year estimates, table B25034 (Year Structure Built), summary file retrieved October 30, 2026 with release identity verified by checksum. Pre-1980 share = the 1970s, 1960s, 1950s, 1940s, and 1939-or-earlier brackets over total units; pre-1940 share is also published per city.
Rules (fixed before the pull). Universe: Texas Census places with ≥ 10,000 housing units (131 places, all resolved to a station publishing the variable; candidate lists were widened for the three places whose nearest stations do not publish it). Index = freeze-days × pre-1980 share. Ties break toward the higher pre-1940 share.
Limitations. Freeze-days are 30-year normals at the nearest reporting station (median distance 10.4 km; maximum 41.4 km) — microclimates are not resolved. Housing age proxies pipe routing and material; it does not measure any individual home. The index covers household plumbing exposure only, not utility infrastructure.
Data download. All 131 cities with both components, station IDs, and distances: texas-burst-pipe-risk-index.csv.
Rainstone Water Heaters provides water heater services across the Dallas–Fort Worth, Austin, and San Antonio areas. This study was produced by Rainstone Water Heaters from public federal data; cities listed did not sponsor or endorse it.
