
Rainstone Water Heaters research program · Data as of the EPA SDWIS snapshot pulled October 22, 2026 · Window: compliance periods beginning January 1, 2021 – December 31, 2025
The short version
We analyzed the EPA’s federal drinking-water compliance record for every Texas community water system serving 25,000 people or more — 174 systems in all — and counted health-based violations over the five most recent complete calendar years.
143 of those 174 systems — roughly 4 in 5 — recorded zero health-based violations in that window. The other 31 recorded at least one. The systems at the top of this page didn’t just stay clean; they stayed clean at scale, serving millions of Texans. The single largest of them, San Antonio Water System, has never recorded a health-based violation in its entire EPA record.
Key findings
- San Antonio Water System (SAWS) is the #1 clean drinking-water system in Texas. Zero health-based violations in 2021–2025, zero in its entire EPA record, serving 2,643,729 people — nearly twice as many as the runner-up.
- Dallas Water Utilities is #2 statewide (1,356,479 served), also with zero health-based violations ever. The only mark in its entire record is a single public-notice item from 2008.
- Three neighboring North Texas cities sweep their size class. Garland, Frisco, and McKinney finish #1, #2, and #3 among clean Texas systems serving 100,000–250,000 people.
- Five Texas systems have a completely empty EPA record — zero violations of any category, ever. Frisco is the largest of them.
- Austin Water is the most-improved large system in Texas. Its health-based violations fell from 4 to 1 between the two five-year windows — a 75% reduction, and the only million-plus system in the state whose count went down.
The statewide clean tier — ranked
How to read this table: a system is in the clean tier if its EPA record shows zero health-based violations (violation categories MCL, MRDL, and TT — see Methodology) with compliance periods beginning in 2021–2025. Within the tier, systems are ranked by population served — staying clean gets harder as a system gets bigger, so scale is the achievement. Monitoring and reporting violations are tracked separately and never counted in the headline metric; where a ranked system has any, we say so.
| Rank | Water system | Population served | Health-based violations, 2021–2025 | Health-based violations, entire EPA record | Notes |
|---|---|---|---|---|---|
| 1 | San Antonio Water System (SAWS) | 2,643,729 | 0 | 0 | Perfect window — zero violations of any category, 2021–2025. No violation of any kind since June 2016. |
| 2 | Dallas Water Utilities | 1,356,479 | 0 | 0 | Perfect window. One lifetime non-health item: a 2008 public-notice violation. |
| 3 | El Paso (city water system) | 747,168 | 0 | — | Leads the 250,000–1,000,000 size class (table below). |
| — | Arlington | 413,955 | 0 | 0 | Perfect window. #2 in its size class; #2 in the DFW metro. |
| — | Plano | 292,059 | 0 | 0 | Perfect window. #3 in its size class; #3 in the DFW metro. |
| — | Garland | 248,822 | 0 | 0 | #1 in the 100,000–250,000 class. Two monitoring/reporting violations in the window (tracked separately, per methodology). |
| — | Frisco | 231,910 | 0 | 0 | Completely empty EPA record — zero violations of any category, ever. |
| — | McKinney | 224,043 | 0 | 0 | #3 in the 100,000–250,000 class. One monitoring/reporting violation in the window. |
| — | Grand Prairie | 201,843 | 0 | — | Perfect window — zero violations of any category, 2021–2025. |
| — | Denton | 150,037 | 0 | — | Perfect window. Ranks #10 in the DFW metro — listed here for completeness; no metro rank is claimed for it. |
| — | Round Rock | 130,662 | 0 | 0 | Completely empty EPA record. #1 perfect-record system in the Austin metro. |
| — | New Braunfels Utilities (NBU) | 116,477 | 0 | 0 | #2 in the San Antonio metro. One monitoring/reporting violation in the window. |
| — | Cedar Park | 86,939 | 0 | 0 | Perfect window. #2 perfect-record system in the Austin metro. |
The complete table — all 174 evaluated systems, clean tier and the rest, with monitoring/reporting counts and each system’s EPA facility-report link — is published with this study as a downloadable CSV. Ranks above #3 are shown in population order among the systems detailed in this edition; the CSV orders the full tier.
A note on who’s not here. 31 of the 174 systems — about 1 in 5 — recorded at least one health-based violation in the window, so they appear in the full results table but not in the clean tier. That includes some very large systems with otherwise strong records. We publish their counts in the CSV rather than ranking them, and we don’t contact them about this study — there is no honor to offer, and that’s not what this page is for.
Size-class tables — where the podium finishes come from
A statewide ranking by population will always be led by the biggest systems. These natural size classes — the same groupings a communications office would use — show which systems lead among their peers.
Systems serving 250,000 – 1,000,000 (clean tier)
| Class rank | Water system | Population served | Health-based violations, 2021–2025 |
|---|---|---|---|
| 1 | El Paso | 747,168 | 0 |
| 2 | Arlington | 413,955 | 0 |
| 3 | Plano | 292,059 | 0 |
Only five Texas systems qualify in this class’s clean tier. Arlington and Plano also finish #2 and #3 in the Dallas–Fort Worth metro ranking, behind Dallas Water Utilities at #1.
Systems serving 100,000 – 250,000 (clean tier)
| Class rank | Water system | Population served | Health-based violations, 2021–2025 |
|---|---|---|---|
| 1 | Garland | 248,822 | 0 |
| 2 | Frisco | 231,910 | 0 |
| 3 | McKinney | 224,043 | 0 |
Three neighboring North Texas cities take the entire podium of the state’s most competitive size class. Within this same class, the perfect-record tier — systems with zero violations of any category in the window, not just zero health-based ones — is led by Frisco (#1), followed by Grand Prairie (#2, 201,843 served).
The completely-empty-record club
Five Texas systems serving 25,000 or more have no violations of any kind in their entire EPA record — no health-based, no monitoring, no reporting, nothing. Ranked by population served, the three largest are:
| Rank | Water system | Population served |
|---|---|---|
| 1 | Frisco | 231,910 |
| 2 | Brownsville Public Utilities Board | 201,249 |
| 3 | Round Rock | 130,662 |
Metro editions
Austin metro — perfect records
| Metro rank (perfect-record tier) | Water system | Population served | Record |
|---|---|---|---|
| 1 | Round Rock | 130,662 | Zero violations of any category, ever |
| 2 | Cedar Park | 86,939 | Zero health-based violations ever; perfect 2021–2025 window |
Round Rock is the Austin metro’s largest completely unblemished system — and the metro’s #2 clean system by population. (Fine print, because it matters: one Austin-metro system ranks ahead of Round Rock on in-window population alone, but its current EPA record shows a health-based violation with a compliance period beginning in April 2026 — after this study’s window closed. We have not contacted that system about any recognition, and the full record is in the CSV.)
San Antonio metro
| Metro rank | Water system | Population served | Health-based violations, 2021–2025 |
|---|---|---|---|
| 1 | San Antonio Water System (SAWS) | 2,643,729 | 0 |
| 2 | New Braunfels Utilities (NBU) | 116,477 | 0 |
Most-improved — systems serving 1,000,000+
| Water system | Population served | Health-based violations, 2016–2020 | Health-based violations, 2021–2025 | Change |
|---|---|---|---|---|
| Austin Water | 1,115,323 | 4 | 1 | −75% |
Austin Water is the only Texas system serving more than a million people whose health-based violation count fell between the two windows — a drop of three violations, or 3 out of every 4 eliminated. Its single in-window violation was a treatment-technique item from February 2022; it has recorded no health-based violation since.
An honesty note about Fort Worth
Fort Worth’s water department publishes its honors proudly, and its overall record is strong — which is exactly why we’re naming it here. Fort Worth’s system (955,900 served) recorded one health-based violation in the window: a treatment-technique violation with a compliance period beginning in March 2021. It is the system’s only health-based violation in its entire EPA record, and its record has been clean since. But under this study’s rules — zero means zero — Fort Worth is not in the clean tier, and no framing puts it there. If a future quarterly refresh keeps its record clean, it will enter the tier on the same terms as everyone else. We’d rather publish a study a communications office can verify line by line than one that bends a rule for a big city.
What this means for your home’s water
A clean system record is genuinely good news: it means the water your utility treats and delivers met federal health standards, on the EPA’s own compliance record, for five straight years.
It’s also only half the story of the water that comes out of your tap. What happens after the water reaches your home is a separate system — yours:
- Sediment and scale. Even excellent source water carries minerals. Hardness builds scale inside water heaters and fixtures over time, quietly shortening their working life — the single most common cause of premature water-heater failure we see.
- Your heater is a storage tank. Water sits in it, sometimes for days. Regular maintenance — flushing sediment, checking the anode rod — is what keeps stored water tasting and smelling like the water your utility delivered.
- Age compounds everything. In older homes, original galvanized or aging copper lines can change water quality between the meter and the glass, whatever the system’s record says.
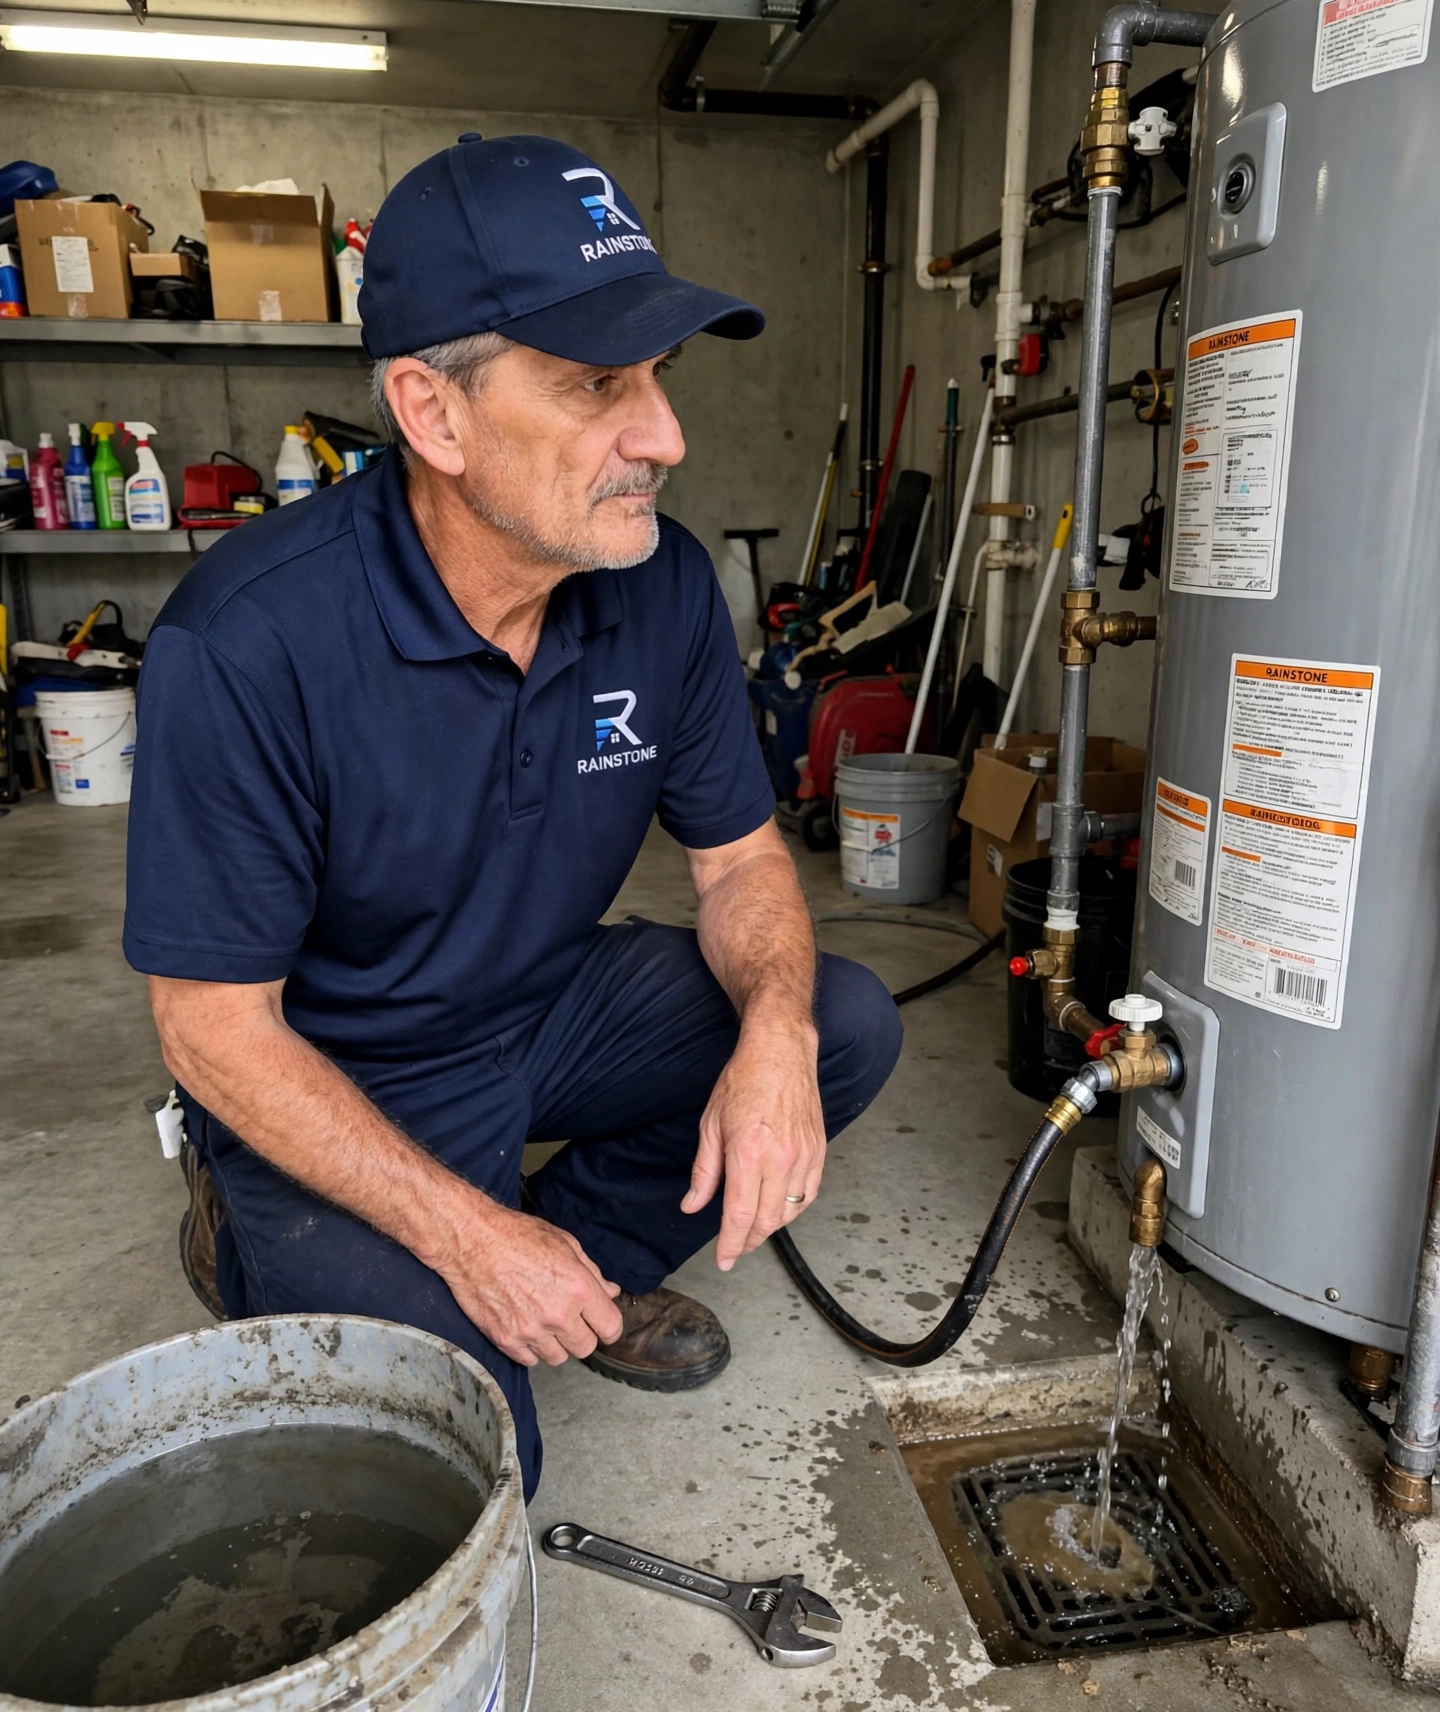
None of that takes anything away from the cities ranked above — it just means a great city record and a well-kept home system are two different achievements, and you control one of them. If you’re in one of our Texas service areas and want a straightforward read on your water heater’s condition, that’s the work Rainstone Water Heaters does every day — no pressure, and this study stands on its own whether or not you ever call us.
Ranked system? Get your badge
If your system appears in the clean tier, you’re welcome to post the result wherever your city posts honors like this — your news page, water-quality page, or awards page. We provide a ready badge (PNG and SVG, with a copy-paste embed), a one-page PDF summary of the study, the video at the top of this page as an embed, and a suggested social post. There’s no cost and no obligation, and your ranking stands whether or not you post anything. Contact the research team at [email protected].
Methodology in brief
Full methodology: published in full below. In short: EPA Safe Drinking Water Information System (SDWIS) data via EPA’s ECHO downloads, pulled October 22, 2026; all active Texas community water systems serving 25,000+ people (174 systems); health-based violations = EPA categories MCL, MRDL, TT with compliance periods beginning January 1, 2021 – December 31, 2025; clean tier ranked by population served; monitoring/reporting violations counted and published separately. One caveat we print rather than bury: EPA itself cautions that SDWIS contains inaccuracies and underreporting, and violation data finalizes roughly a quarter behind real time. If any figure for your system looks wrong, tell us — we publish corrections in a visible log.
FAQ
Where does this data come from? The EPA’s Safe Drinking Water Information System — the federal compliance record every public water system in the country reports into — via EPA’s ECHO data downloads. Every figure on this page can be checked against the system’s own EPA facility report.
Why rank by population served? Because staying violation-free is harder at scale: more water, more infrastructure, more sampling points, more chances for something to go wrong. Within the clean tier, population is the honest ordering. Size-class and metro tables show how systems compare against their peers.
Does a monitoring violation disqualify a system? No. Monitoring and reporting violations (a late sample, a missed report) are a different category from health-based violations (a contaminant over its limit, a treatment failure). We count them, publish them, and use them as a tie-break — we never fold them into the headline metric.
How often does this update? On each quarterly EPA data release. Rankings from different quarters are never mixed in one table, and prior editions stay archived.
Can our city use the badge without linking to this page? Yes. The embed snippet links here because that’s the convenient default, but the ranking is not conditioned on posting, linking, or anything else.
Full methodology
Published with the study so any reader — including a city communications office — can verify every claim on this page. This methodology was fixed in writing before the data pull was run. The ranking rules below were not adjusted after seeing which systems won.
1. Data source
- Dataset: U.S. Environmental Protection Agency, Safe Drinking Water Information System (SDWIS), accessed via EPA’s ECHO (Enforcement and Compliance History Online) data downloads and the Envirofacts service.
- Pull date: October 22, 2026. The exact EPA data vintage (“data as of”) is stamped on this page and on every badge and outreach asset. All figures in this edition come from that single pull; figures from different quarters are never mixed in one table.
- Records pulled: the full SDWIS record for all 4,757 active Texas community water systems, with complete violation and geographic-area records for the 174 systems serving 25,000 or more people (the study universe — see §2).
- Cross-check tools: ECHO Drinking Water Search facility reports and the SDWIS Search at enviro.epa.gov, which report health-based vs. monitoring violations per system.
2. Universe and population floor
- Included: active community water systems (CWS) in Texas with retail population served ≥ 25,000, per the SDWIS system inventory.
- Resulting universe: 174 systems.
- The 25,000 floor exists so every ranked system is a substantial municipal supplier and no rank rests on a tiny system’s thin record. Systems below the floor are not ranked and are not contacted.
- Wholesale suppliers that hold no retail system of their own in SDWIS (e.g., regional water authorities whose treated water is delivered through member cities’ systems) do not appear as ranked systems; the retail system that serves residents carries the record.
3. Study window
- Window: violations whose compliance period begins on or between January 1, 2021 and December 31, 2025 — the five most recent complete calendar years.
- “2021–2025” always means this compliance-period-begin definition, stated here so any system’s team can reproduce the count from its own EPA facility report.
- “Entire record” / “ever” claims mean the system’s complete SDWIS record as returned on the pull date — phrased on this page as “no health-based violations in EPA records” with the pull date attached.
- The data is re-pulled the week of launch, and on each quarterly EPA release thereafter. A violation recorded after the window (for example, one with a 2026 compliance-period begin date) does not change a system’s in-window result, but it is disclosed wherever it bears on a recognition decision — this edition contains one such case, flagged in this study’s Austin-metro table note and in the downloadable data.
4. What counts as a health-based violation
Per EPA’s SDWA data dictionary, a violation is health-based if its violation category code is one of:
- MCL — Maximum Contaminant Level exceeded
- MRDL — Maximum Residual Disinfectant Level exceeded
- TT — Treatment Technique violation
All other categories — monitoring (MR / MON), reporting (RPT), public notice, and “Other” — are counted separately, published in their own column in the full results table, and never folded into the headline metric. Where a ranked system has monitoring/reporting violations in the window, this page discloses the count next to its name.
Worked examples from this edition, so the definition is auditable:
- Fort Worth’s system recorded one in-window violation with category TT, compliance period beginning March 2021 (contaminant code 0800, rule code 123). Category TT is health-based → the system is not in the clean tier.
- Austin Water’s in-window violation is category TT, compliance period beginning February 2022 (contaminant code 0300, rule code 122). Same result — disclosed on this page, and Austin is presented under the most-improved framing instead.
- Garland’s two in-window violations are category MR (monitoring/reporting). Not health-based → Garland remains in the clean tier, with the count disclosed.
5. System-to-city mapping
- Each ranked entry is a water system (identified by its EPA Public Water System ID, PWSID), presented with the city or cities it principally serves.
- A city’s system is the community water system whose service area covers the largest share of the city’s population, determined by (i) SDWIS inventory city-served data, cross-checked with (ii) spatial overlap between EPA’s Community Water System Service Area Boundaries dataset and Census place boundaries.
- One system per city in city-facing tables. The full mapping (system → PWSID → population served → cities served) ships in the downloadable CSV.
- Named systems in this edition: San Antonio Water System (SAWS, TX0150018) · Dallas Water Utilities (TX0570004) · Arlington (TX2200001) · Plano (TX0430007) · Garland (TX0570010) · Frisco (TX0430005) · McKinney (TX0430039) · Round Rock (TX2460003) · Cedar Park (TX2460009) · New Braunfels Utilities (TX0460001) · Austin Water (TX2270001) · Fort Worth (TX2200012).
6. Ranking rules
- Clean tier = systems in the universe with zero health-based violations in the window. In this edition, 143 of 174 systems qualify.
- Statewide order: within the clean tier, systems are ordered by population served, descending. Rationale, stated publicly: staying violation-free is harder at scale, so scale is the achievement the ranking honors.
- Tie-break: if two clean-tier systems serve the same population, the one with fewer monitoring/reporting violations in the window ranks higher. (No tie at equal population occurred in this edition’s published tables.)
- Size classes (natural groupings, fixed before the pull): systems serving 1,000,000+; 250,000–1,000,000; 100,000–250,000; ranked within class by the same rule.
- Metro fields use official Census CBSA definitions: Dallas–Fort Worth (19100), Austin–Round Rock–San Marcos (12420), San Antonio–New Braunfels (41700). System-to-metro assignment is by county served.
- Perfect-record tier (a stricter subset, always labeled as such): systems with zero violations of any category in the window. The completely-empty-record designation is stricter still: zero violations of any category in the system’s entire SDWIS record.
- Most-improved framing: change in health-based violation count between 2016–2020 and 2021–2025, computed only for systems serving 1,000,000+. A system presented as most-improved is not described as being in the clean tier, and its in-window violation is disclosed in the same table.
- Systems with one or more in-window health-based violations appear in the full published results table with their counts. They receive no outreach from this program.
7. Verification pass
Before publication, the top-ranked systems were cross-checked against (a) their ECHO Drinking Water Search facility report and (b) the utility’s most recent Consumer Confidence Report, where available. Where a secondary source disagrees with SDWIS, the EPA record governs and the discrepancy is footnoted in the downloadable data.
8. Limitations — printed, not buried
- EPA’s own caveat: EPA cautions that SDWIS contains inaccuracies and underreporting, and that violation data finalizes roughly a quarter behind real time (states receive a verification period before data reaches ECHO). A clean record means no health-based violations recorded by EPA in the window — the study claims exactly that, no more.
- Population served is the SDWIS inventory figure for the system, not the Census population of the city it serves; the two differ where a system serves areas outside city limits or a city is served by more than one system.
- Violation counts measure regulatory compliance events, not a laboratory grade of water at any individual tap. The study does not measure taste, hardness, or in-home plumbing condition, and says so.
9. Corrections policy
If any figure for your system looks wrong, contact the research team at [email protected]. Corrections are verified against the EPA record, applied to this page and the CSV, and logged in a public corrections log with dates. A correction never requires a system to post, link, or pay anything.
10. Refresh and archiving
This study re-runs on each quarterly ECHO SDWA release. Prior editions remain archived at dated URLs. A system that enters or leaves the clean tier does so only through a new edition under this same methodology.
